The differences between NPS, CSAT and CES: When should you use each?
The differences between NPS, CSAT and CES, with calculation examples and use cases. Choose a measure based on the decision you need to make, then interpret the result alongside customer and process records.

What is the difference between NPS, CSAT and CES?
NPS measures the likelihood to recommend, CSAT measures satisfaction with a specific experience, and CES measures the effort needed to get something done. Choose a measure based on the decision your team needs to make. If you are looking for the difficult steps in a returns process, you can start with CES; if you want to learn how satisfied customers are with the outcome, start with CSAT. Interpret the result alongside the relevant operational record.
| Measure | Core question | Which decision does it help with? |
|---|---|---|
| NPS | “How likely are you to recommend us?” | Examining the likelihood to recommend across customer groups and how it changes over time. |
| CSAT | “How satisfied were you with this experience?” | Finding the causes of dissatisfaction in a defined experience such as delivery or support. |
| CES | “How easy was it for you to complete this task?” | Finding the difficult steps in a returns, problem-resolution or application process. |
What is NPS and how is it calculated?
The Net Promoter Score (NPS) asks how likely a customer is to recommend a company, product or service. In Bain’s definition, on a 0–10 scale, people who answer 9–10 are promoters, those who answer 7–8 are passives and those who answer 0–6 are detractors. The result is a score between −100 and +100.
How to calculate NPS:
- Sort the valid responses into promoters, passives and detractors.
- Divide the number of promoters and the number of detractors by the total number of valid responses, passives included.
- Subtract the percentage of detractors from the percentage of promoters.
NPS = Percentage of promoters − Percentage of detractors
Example: If 50 of 100 responses come from promoters, 20 from passives and 30 from detractors, the NPS is 20. Passives are included in the total number of responses. The result does not mean that “20% of customers are satisfied.”
In a management presentation, add the period, the number of responses, the customer group invited and the survey channel next to the NPS. The difference between two scores also carries statistical uncertainty. For a first look at the difference between two independent periods, you can use Nord CX’s free NPS significance test. If the same customers responded in both periods, or if the sample or the question changed, a separate assessment is needed.
What is CSAT and how is it calculated?
The Customer Satisfaction Score (CSAT) measures satisfaction with a defined experience. First establish the scale and which responses count as “satisfied.” In the common 1–5 approach described by Qualtrics, responses of 4 and 5 count as satisfied:
CSAT = (Number of responses rated 4 or 5 ÷ number of valid responses) × 100
This rule does not automatically apply to every scale. If 150 of 200 responses fall into these two categories, CSAT is 75%.
The question “Are you satisfied with support?” and the question “Are you satisfied with how your last request was resolved?” describe different experiences. On the day you change the question wording or the survey timing, add a note to the trend chart. When comparing teams’ performance, also check whether their mix of customers and topics differs. If you plan to use the measure in employee evaluations, separately consider the risks of tying customer experience metrics to bonuses.
What is CES, and how is it calculated and interpreted?
The Customer Effort Score (CES), as Qualtrics defines it, measures the effort needed to resolve a request or complete a task. You can ask about ease or use a scale to rate agreement with a statement. So state the question, the scale and the direction of the score in your report: Does a higher score mean easier or harder? Also state how you calculate the summary score, and do not compare CES values from different scales directly.
Example calculation: In an approach that uses the arithmetic mean, the sum of the scores is divided by the number of valid responses. In SurveyMonkey’s example, 100 responses on a 1–7 scale add up to 450, so the average CES is 4.5. This is not the one universal way to calculate CES.
If you are examining the returns process, review the CES alongside records of repeat contacts on the same issue, channel switching and completion time. After a response of “It was difficult,” look at the record you already have before asking the customer to explain the process again. To see the cost of repeat contacts on the same issue, you can use Nord CX’s free repeat-request cost tool.
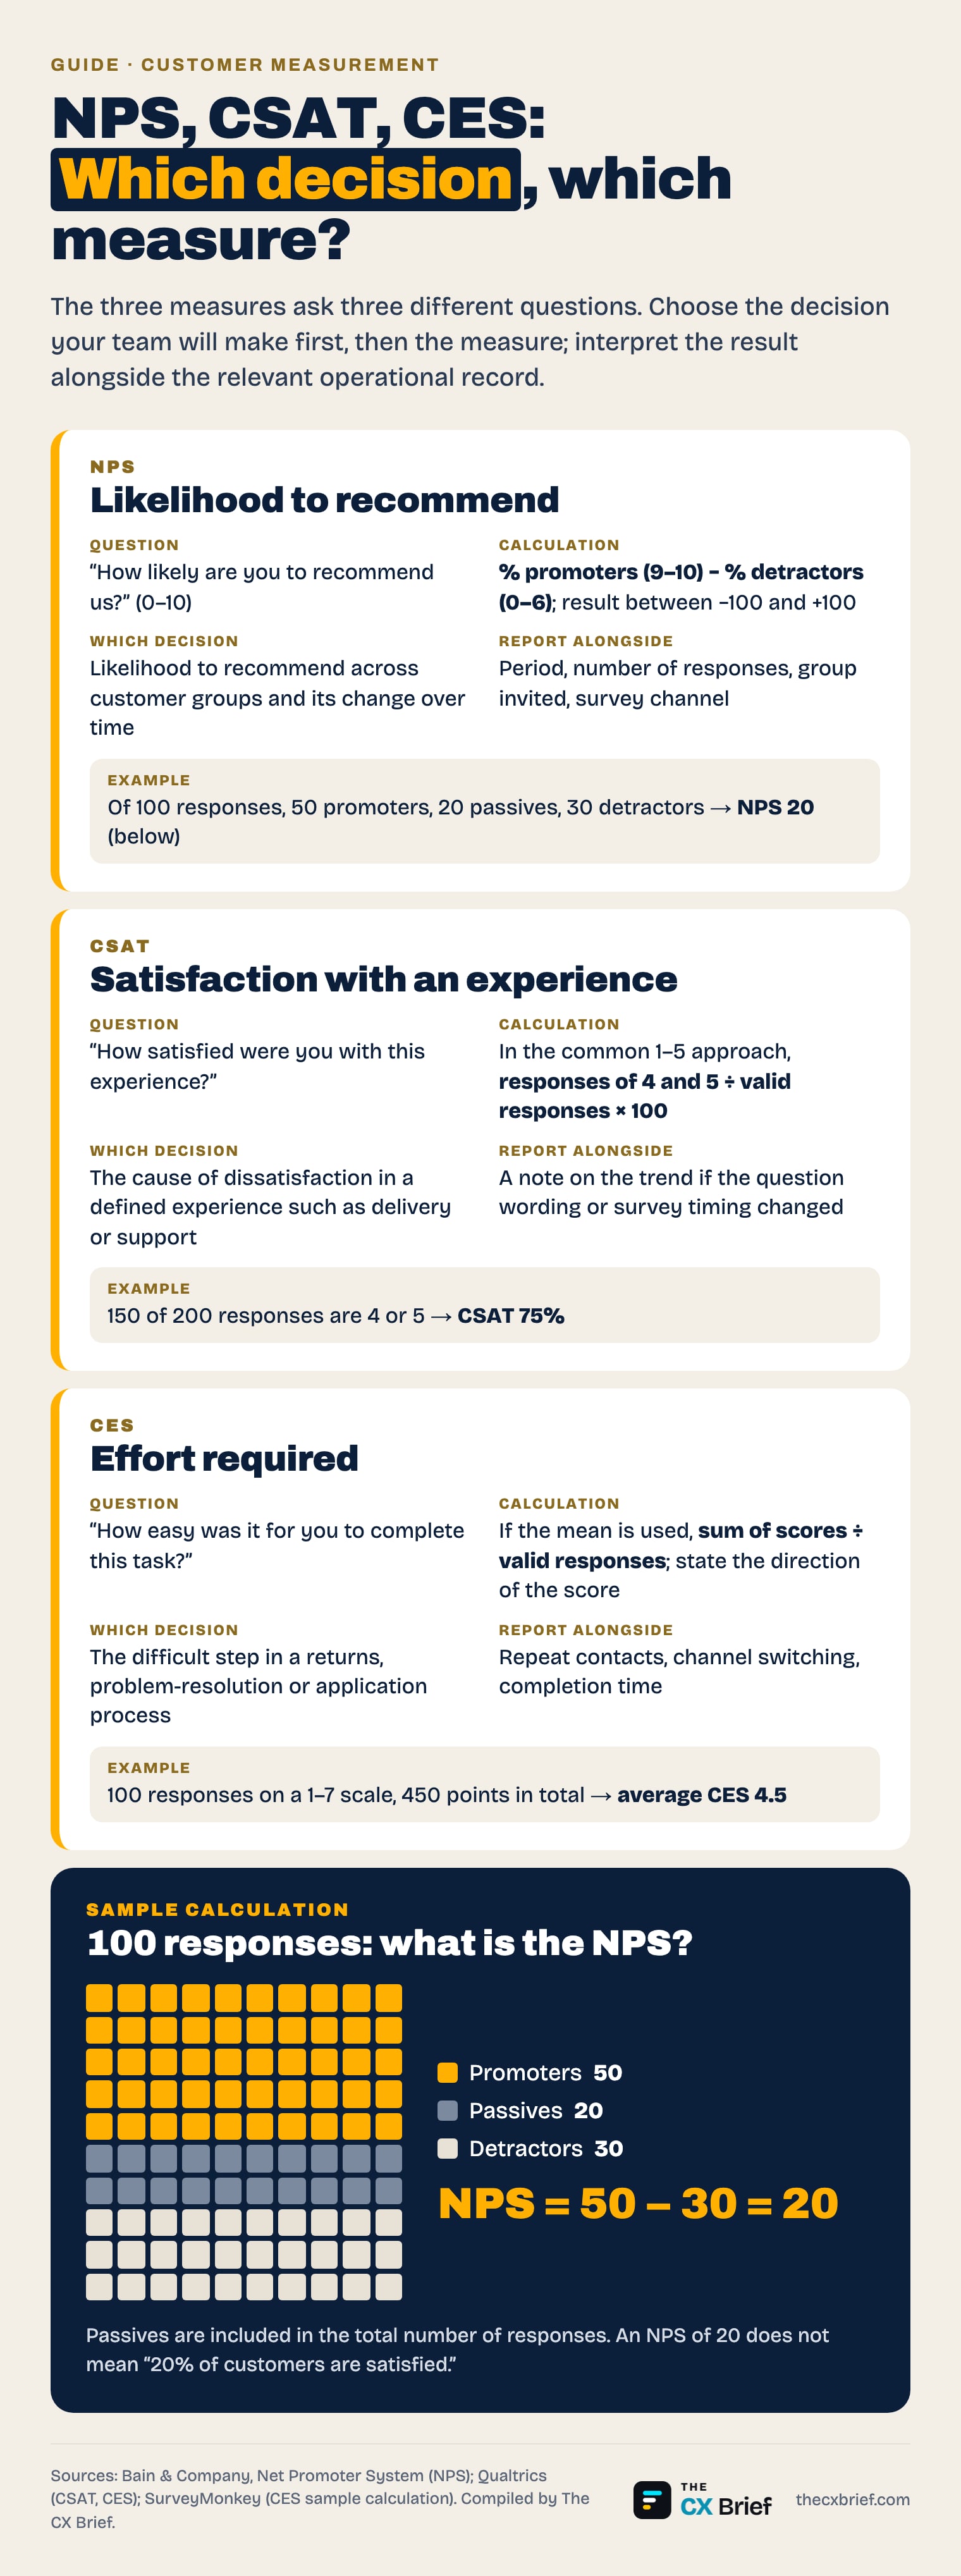
When should you use NPS, CSAT and CES?
Consider a sample returns journey for a CX team in Türkiye. Define the goal as “the customer should not have to call again to find out the status of their return.” Once the process is complete, CES can point to the problematic step; CSAT can complement it by measuring the customer’s satisfaction with the outcome. Rather than asking the relationship-level NPS question again after every transaction, assess it in a separate measurement plan. This sequence is a suggested practice; every organization’s journey and data capabilities are different.
In the first week, start with one journey, one question and one process owner. Check the common cause of negative responses against existing customer records; choose one fix and track it in the next period with the same definition. Take non-respondents into account as well: a survey result directly reflects only those who responded. To assess survey results together with usage and service records, see the customer health score guide.
Frequently asked questions
What is the difference between NPS and CSAT?
NPS measures the likelihood to recommend, while CSAT measures satisfaction with a specific experience, so they do not answer the same question. CSAT can be used to learn how satisfied customers are with the outcome of a delivery, and NPS to track the likelihood to recommend over time. Before choosing a measure, write down the decision you will make, and assess the result together with the relevant customer and process records.
Are passives included in the NPS calculation?
Yes. Passives, who answer 7 or 8, are included in the total number of valid responses, but they do not enter the calculation as a separate group when detractors are subtracted from promoters. If 50 of 100 responses come from promoters, 20 from passives and 30 from detractors, the NPS is 20. This result does not mean that 20% of customers are satisfied.
Should CES be high or low?
That depends on the direction of the question and the scale. In some approaches a high score indicates ease; in others it indicates more effort. In your report, state the question wording, the ends of the scale and the calculation used. Do not directly compare CES scores that use different scales or scoring directions.
What is a good NPS?
First determine which type of score you are comparing. Bain treats relationship NPS, experience NPS and competitive benchmarking separately; relationship and experience scores should not be compared directly. When reviewing your own reporting periods, look at the question, the customer group and the survey channel together. Do not label a single score good or bad in every situation.
Related story: Customers who stop responding to surveys. For a longer read: The survey has expired. Before sending more surveys, be clear about which decision this data will inform.
Translated from the Turkish original.